see our advert in the buyers guide section
see our full page ad facing the buyers guide
see our full page
Frequency

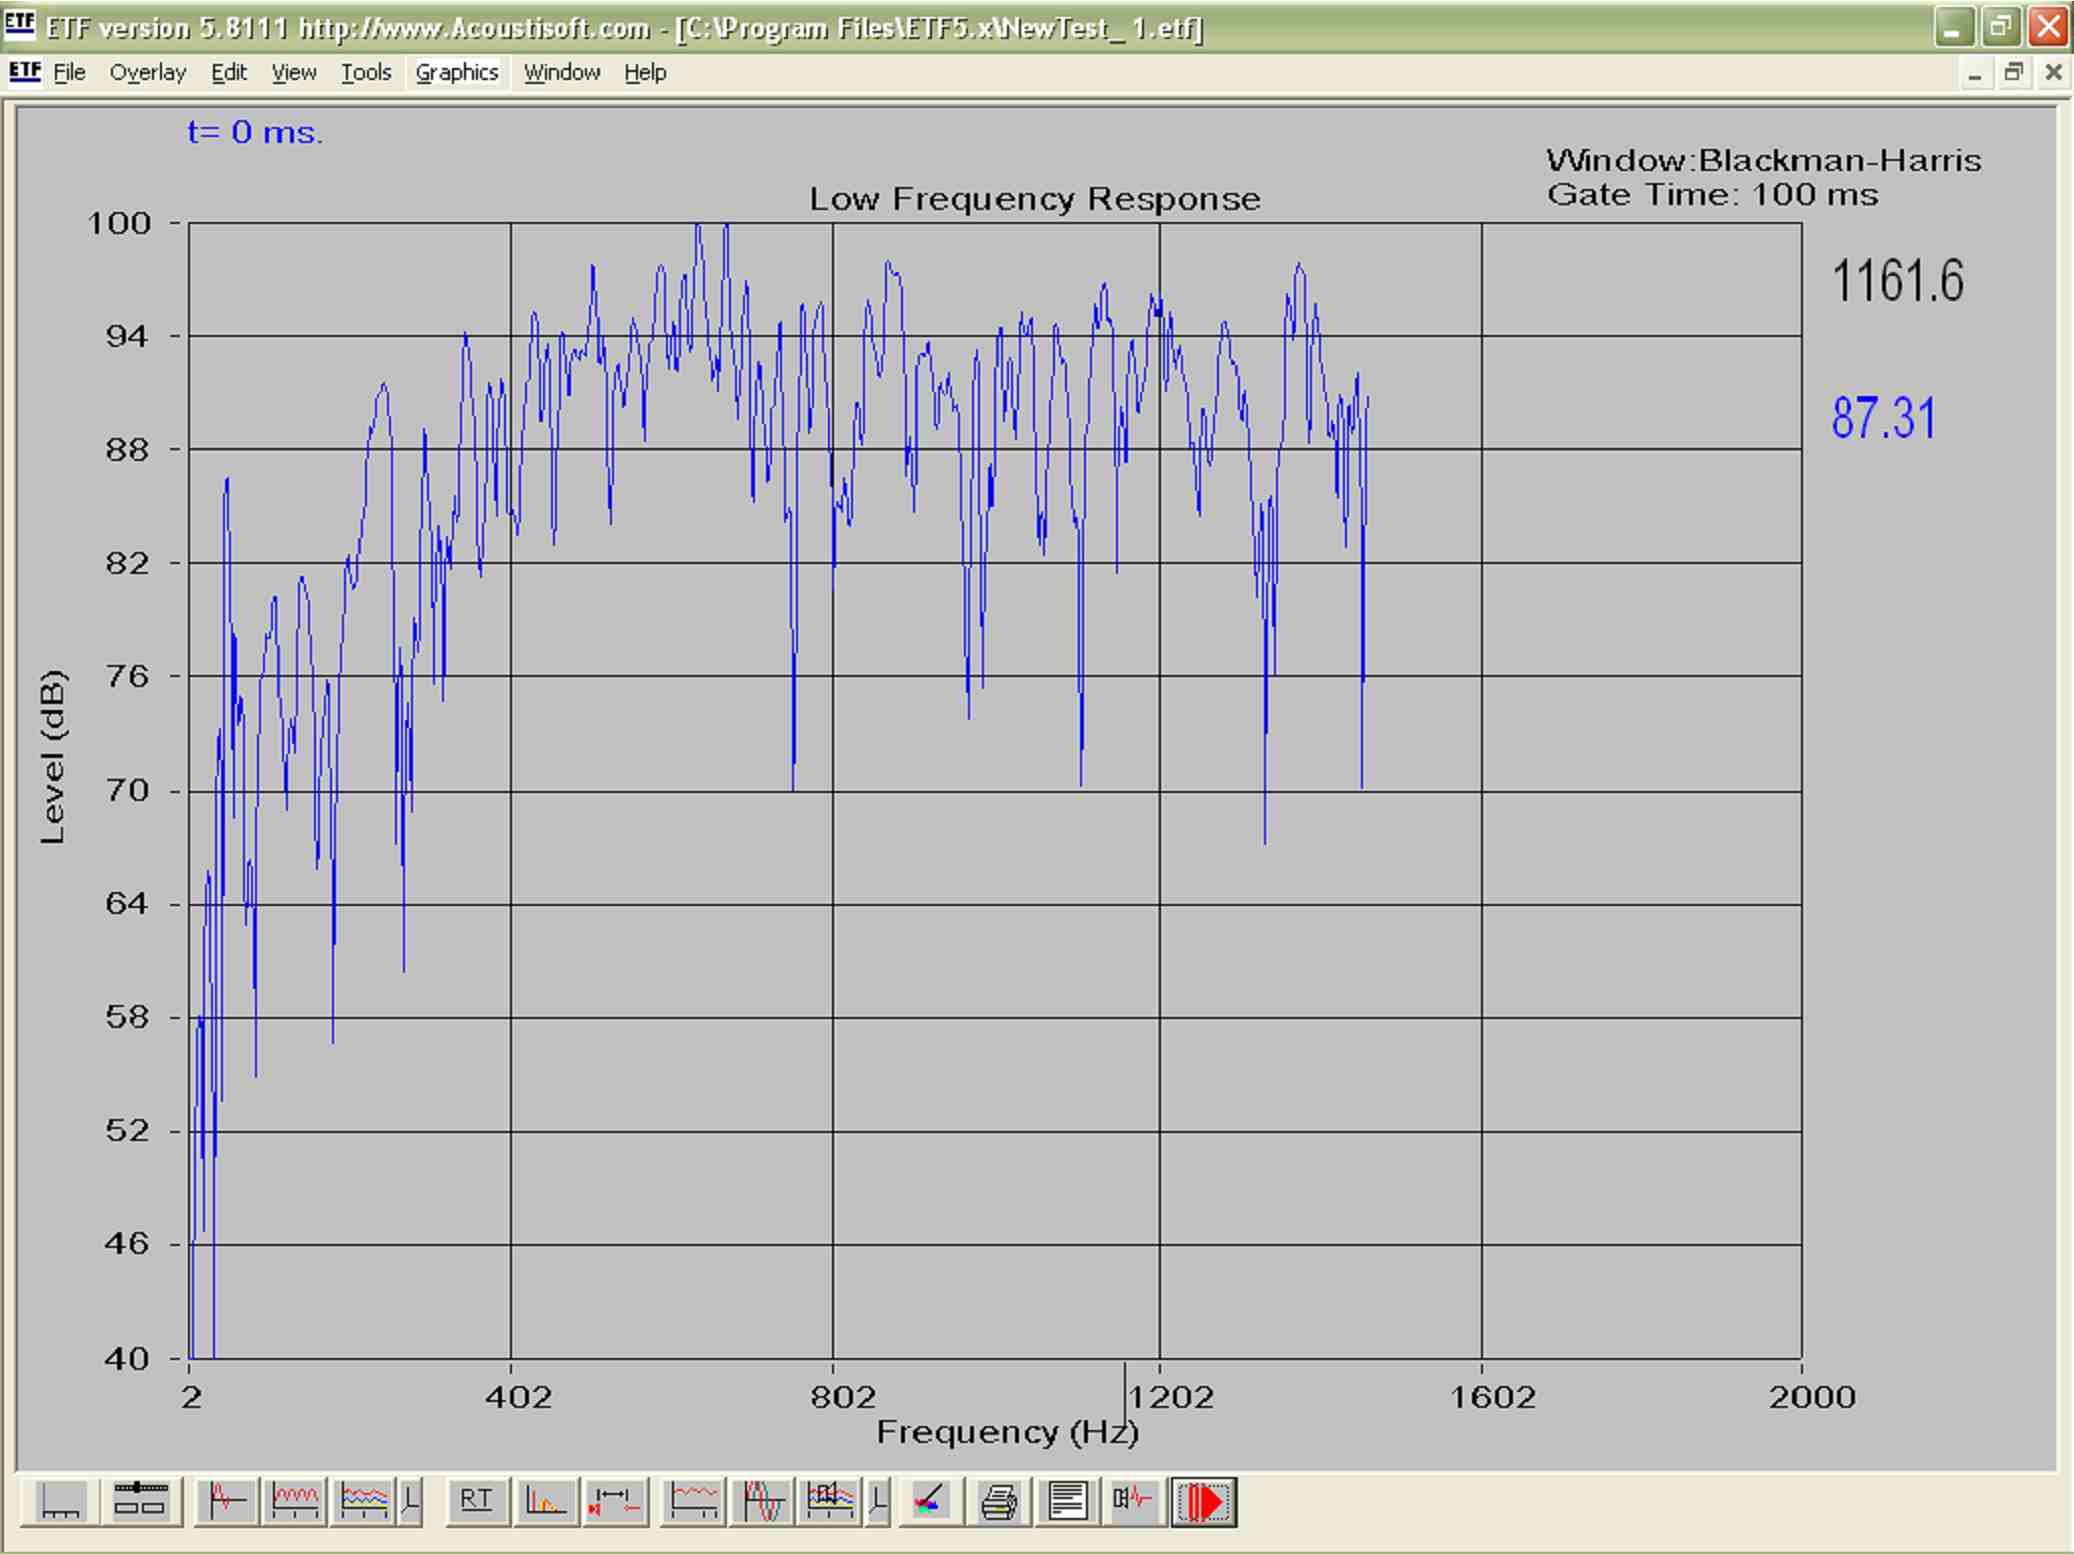
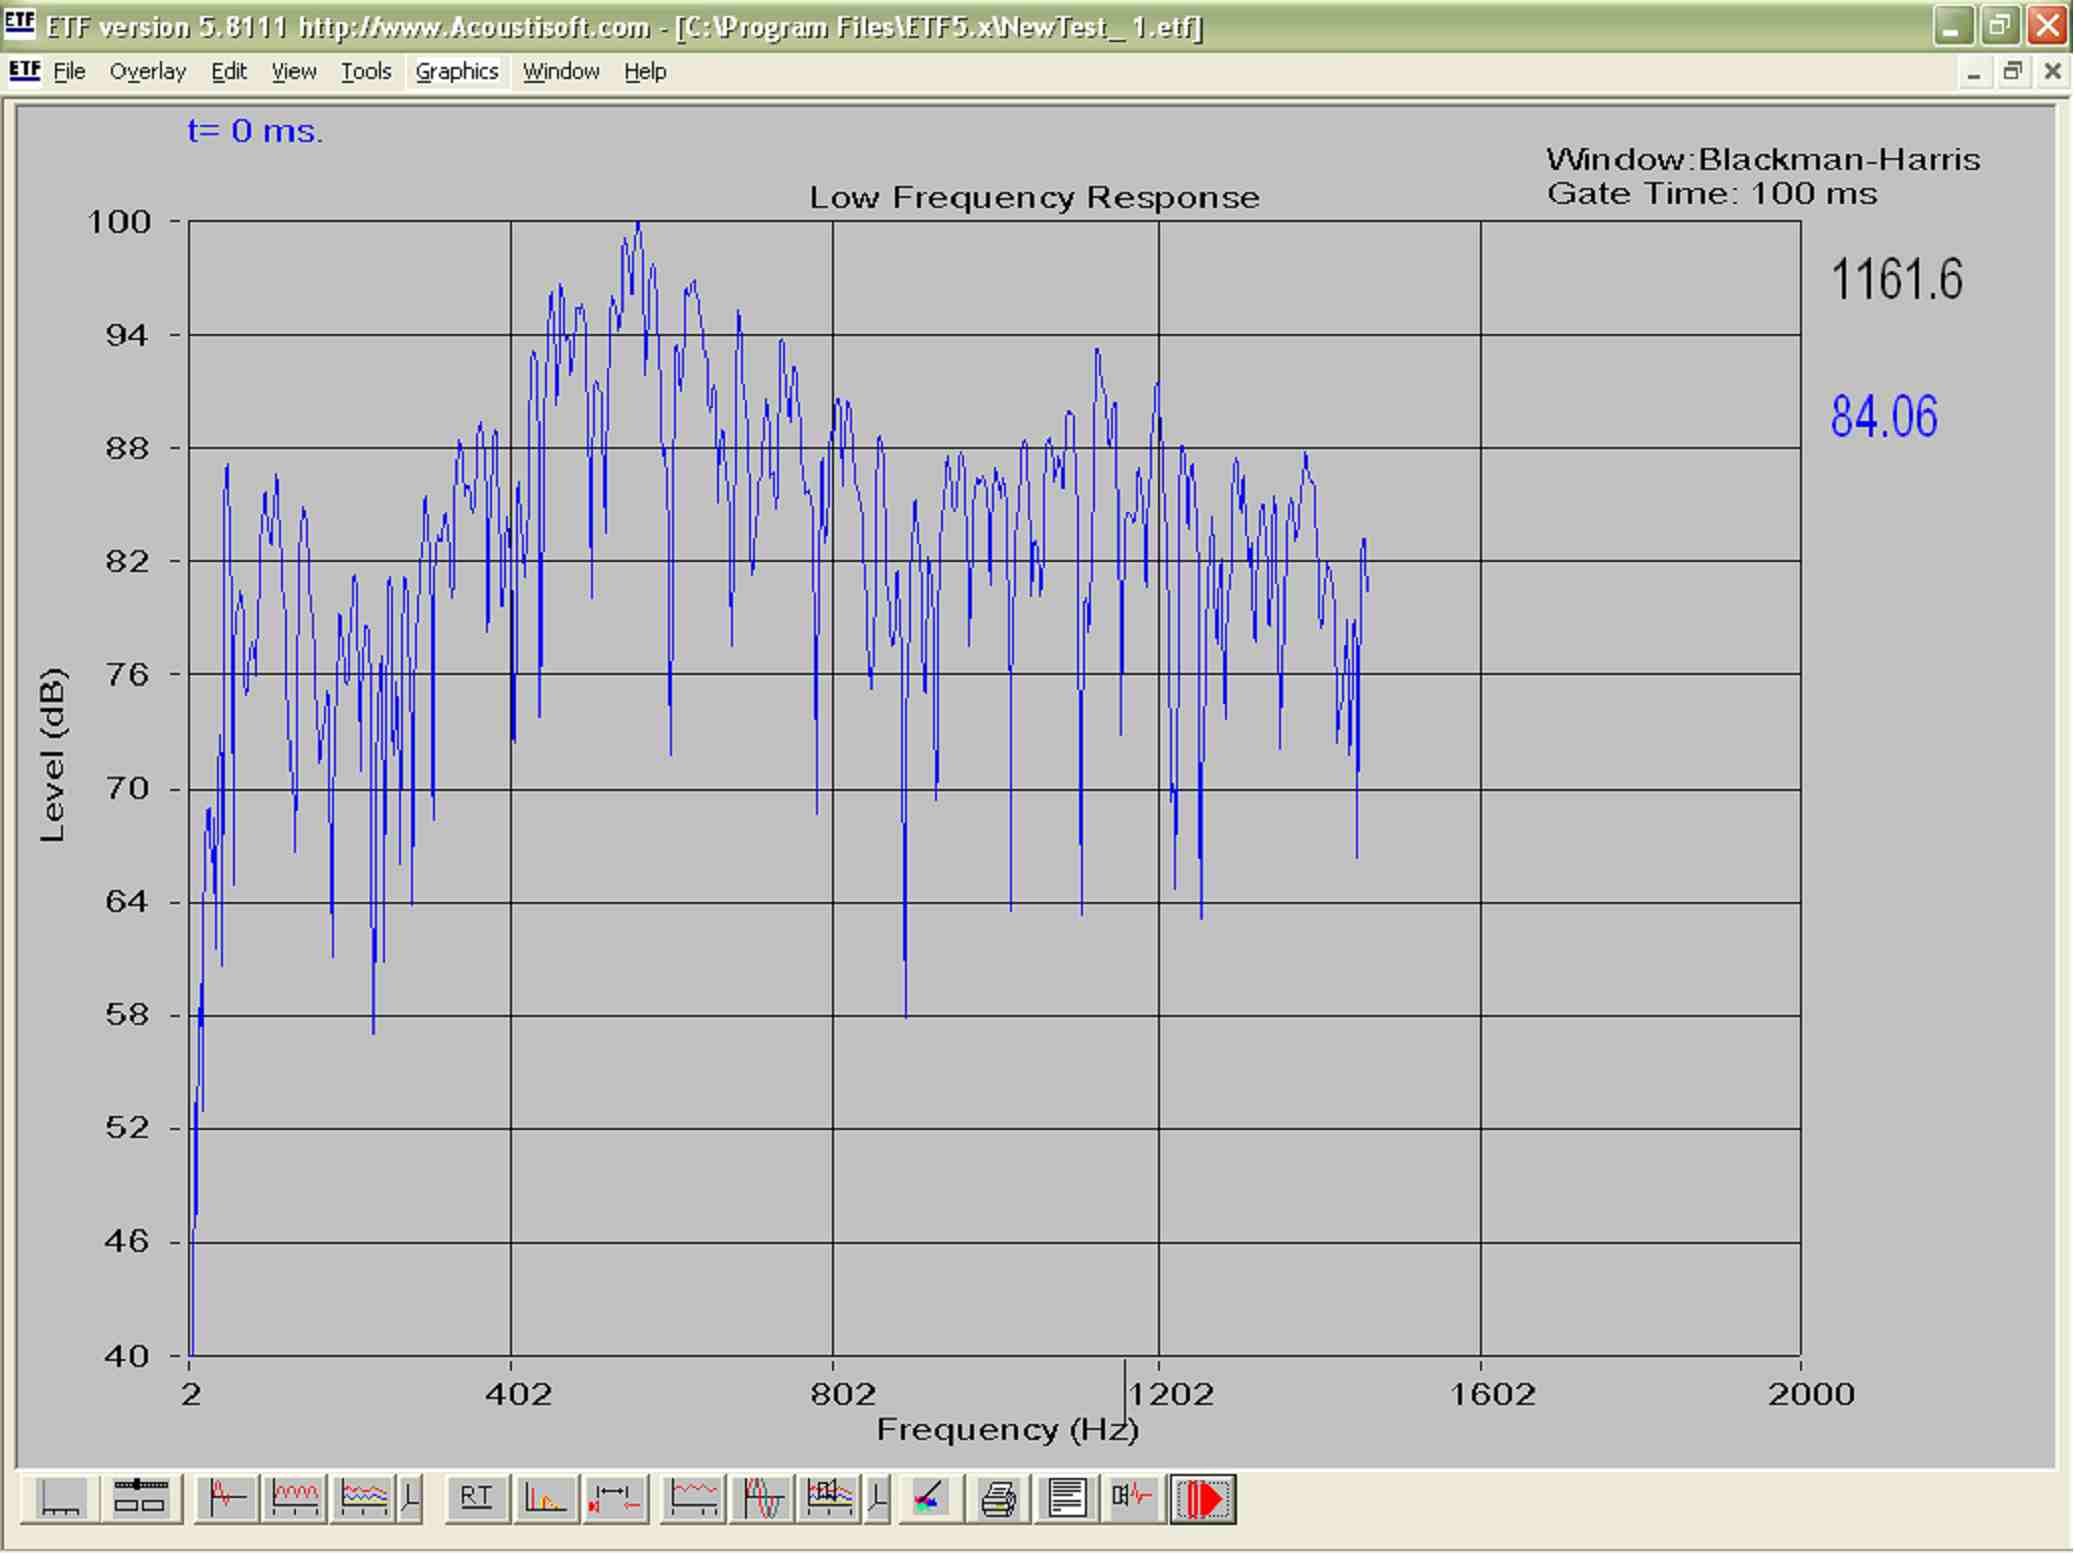
Frequency Response is obtained using a variety of techniques - suitable for different situations

    Spectra RTA laptop software

      Swept sine recorded with peak hold, memories used to compare differences

    ETF MLS laptop software

      very good for LF, transient response, waterfall plots, pseudo anechoic allows accurate bass in lounge to discern direct from reverberated paths.

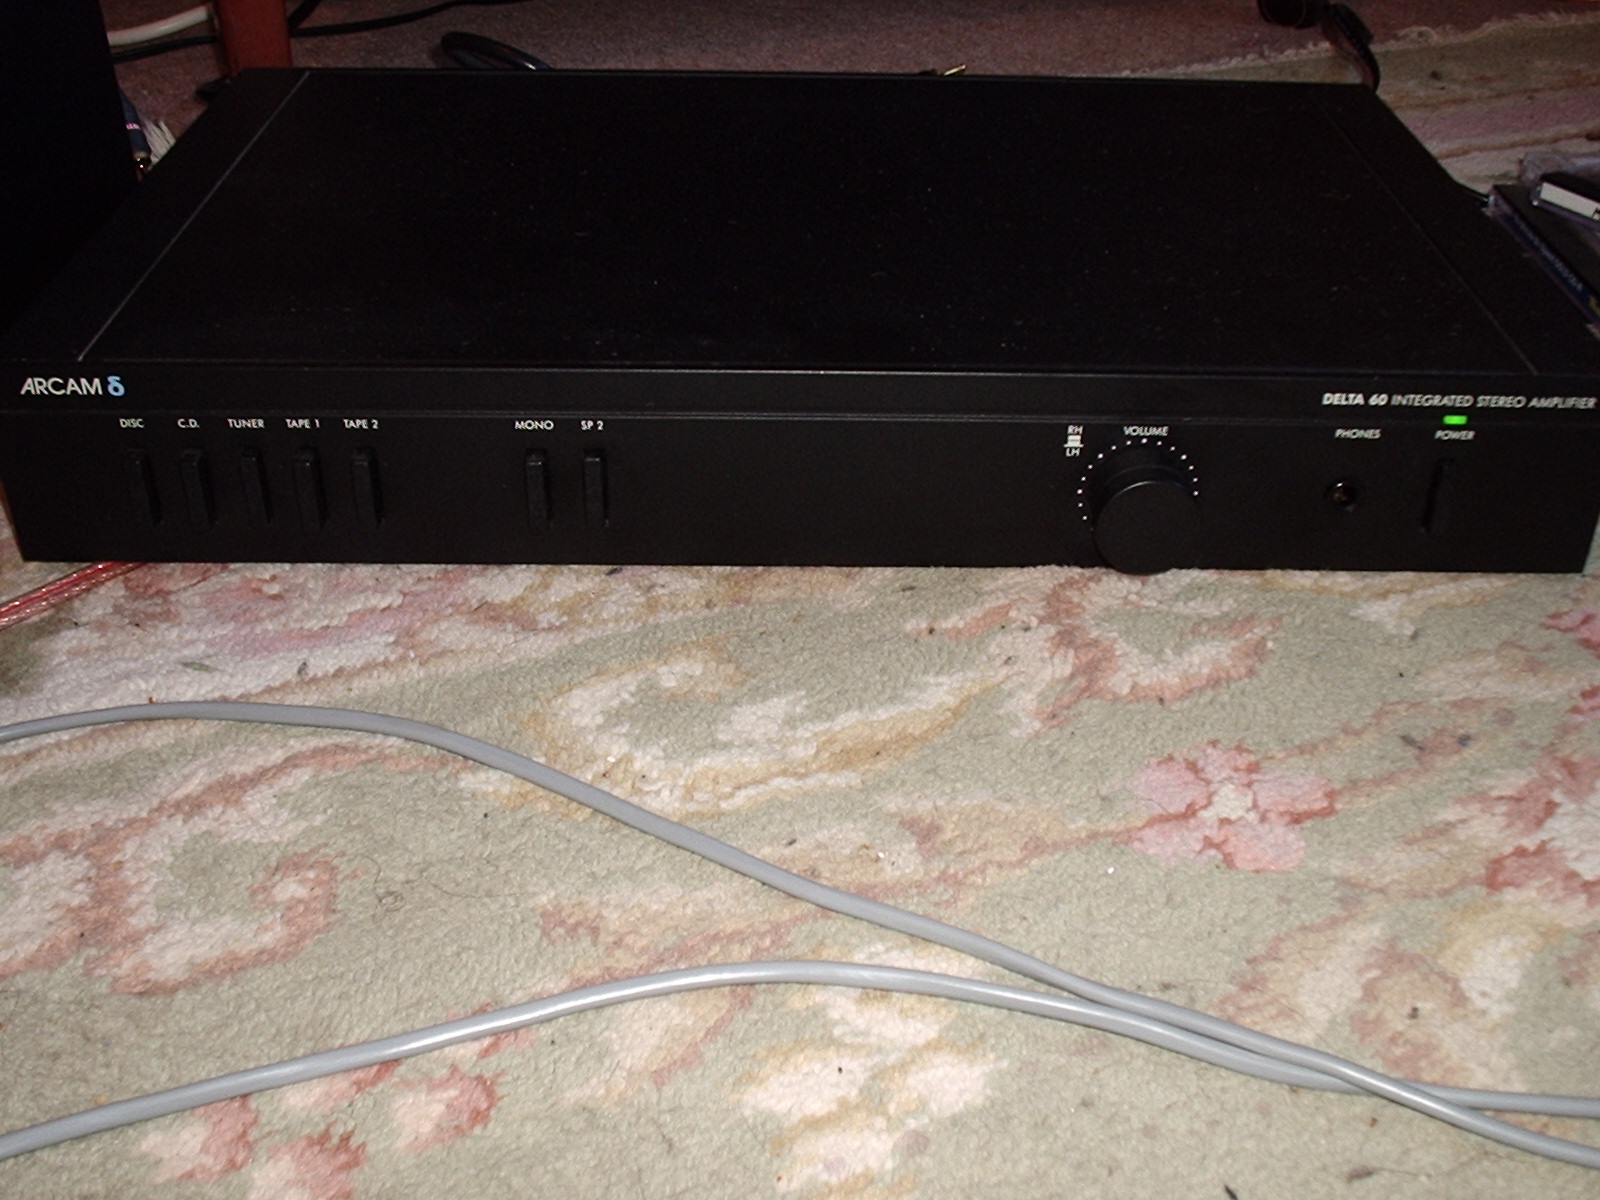
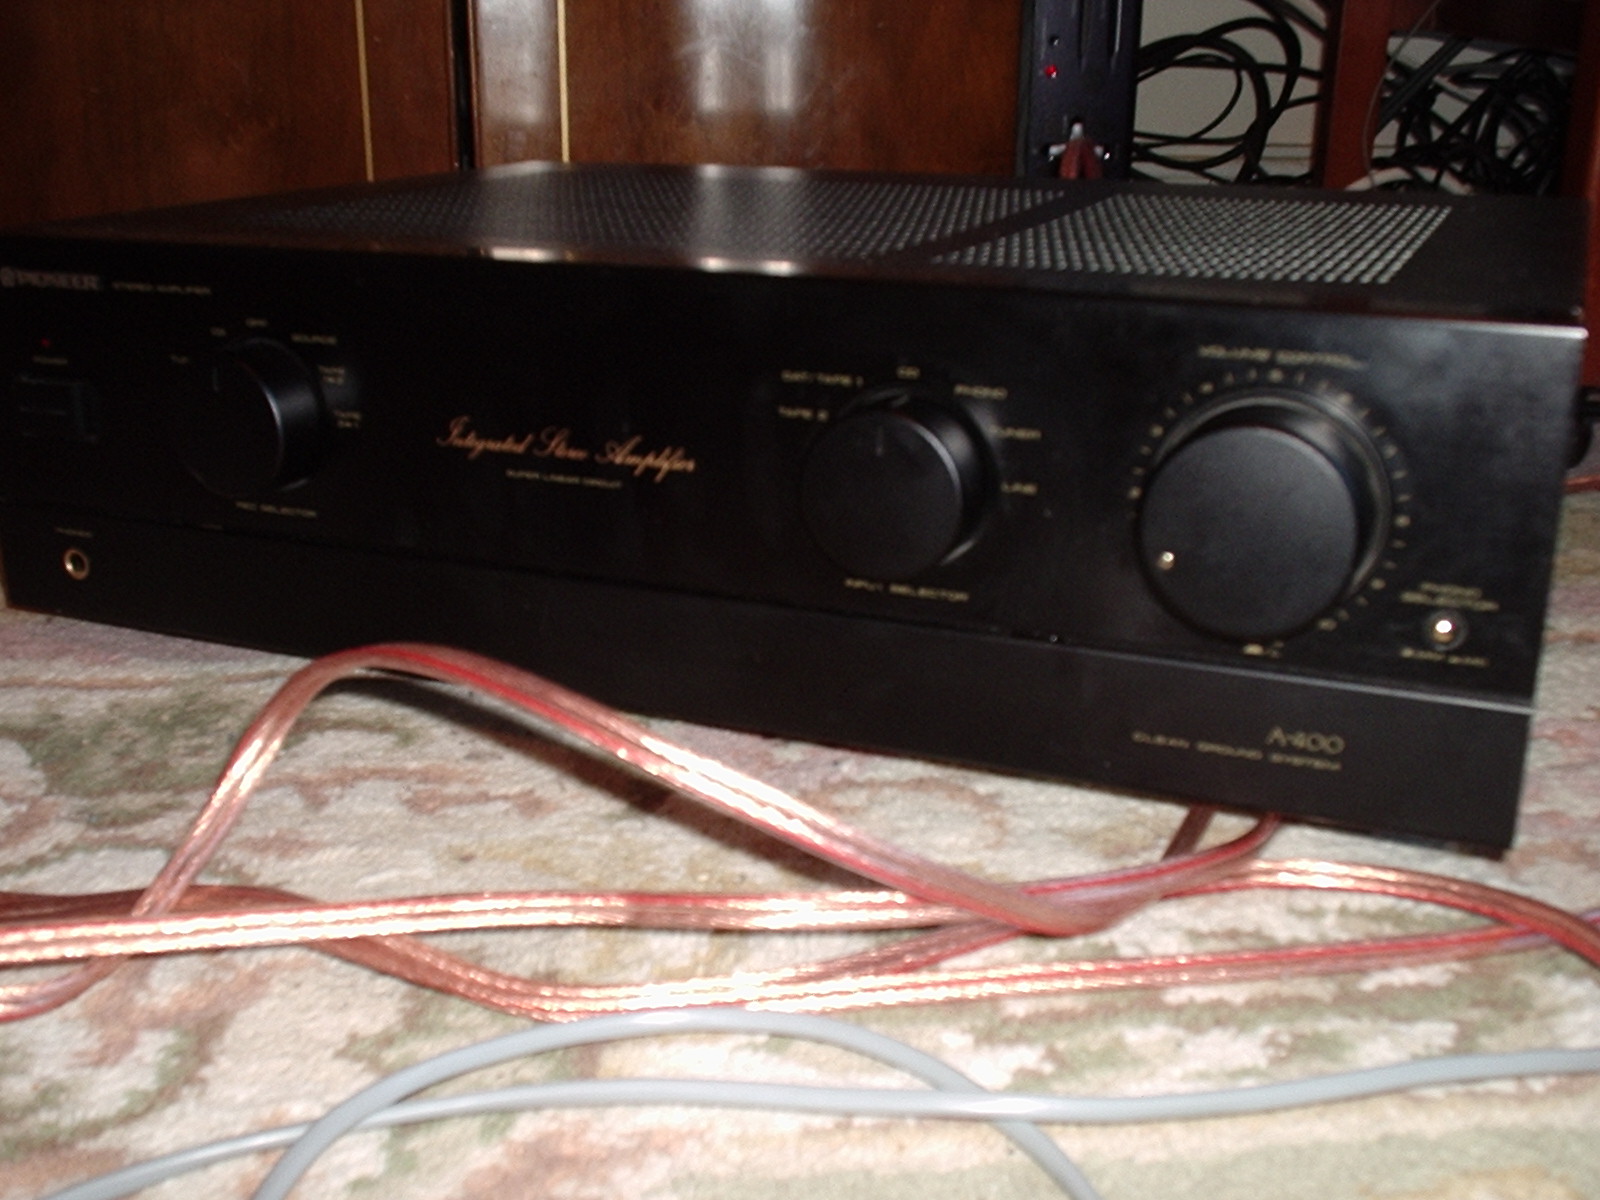
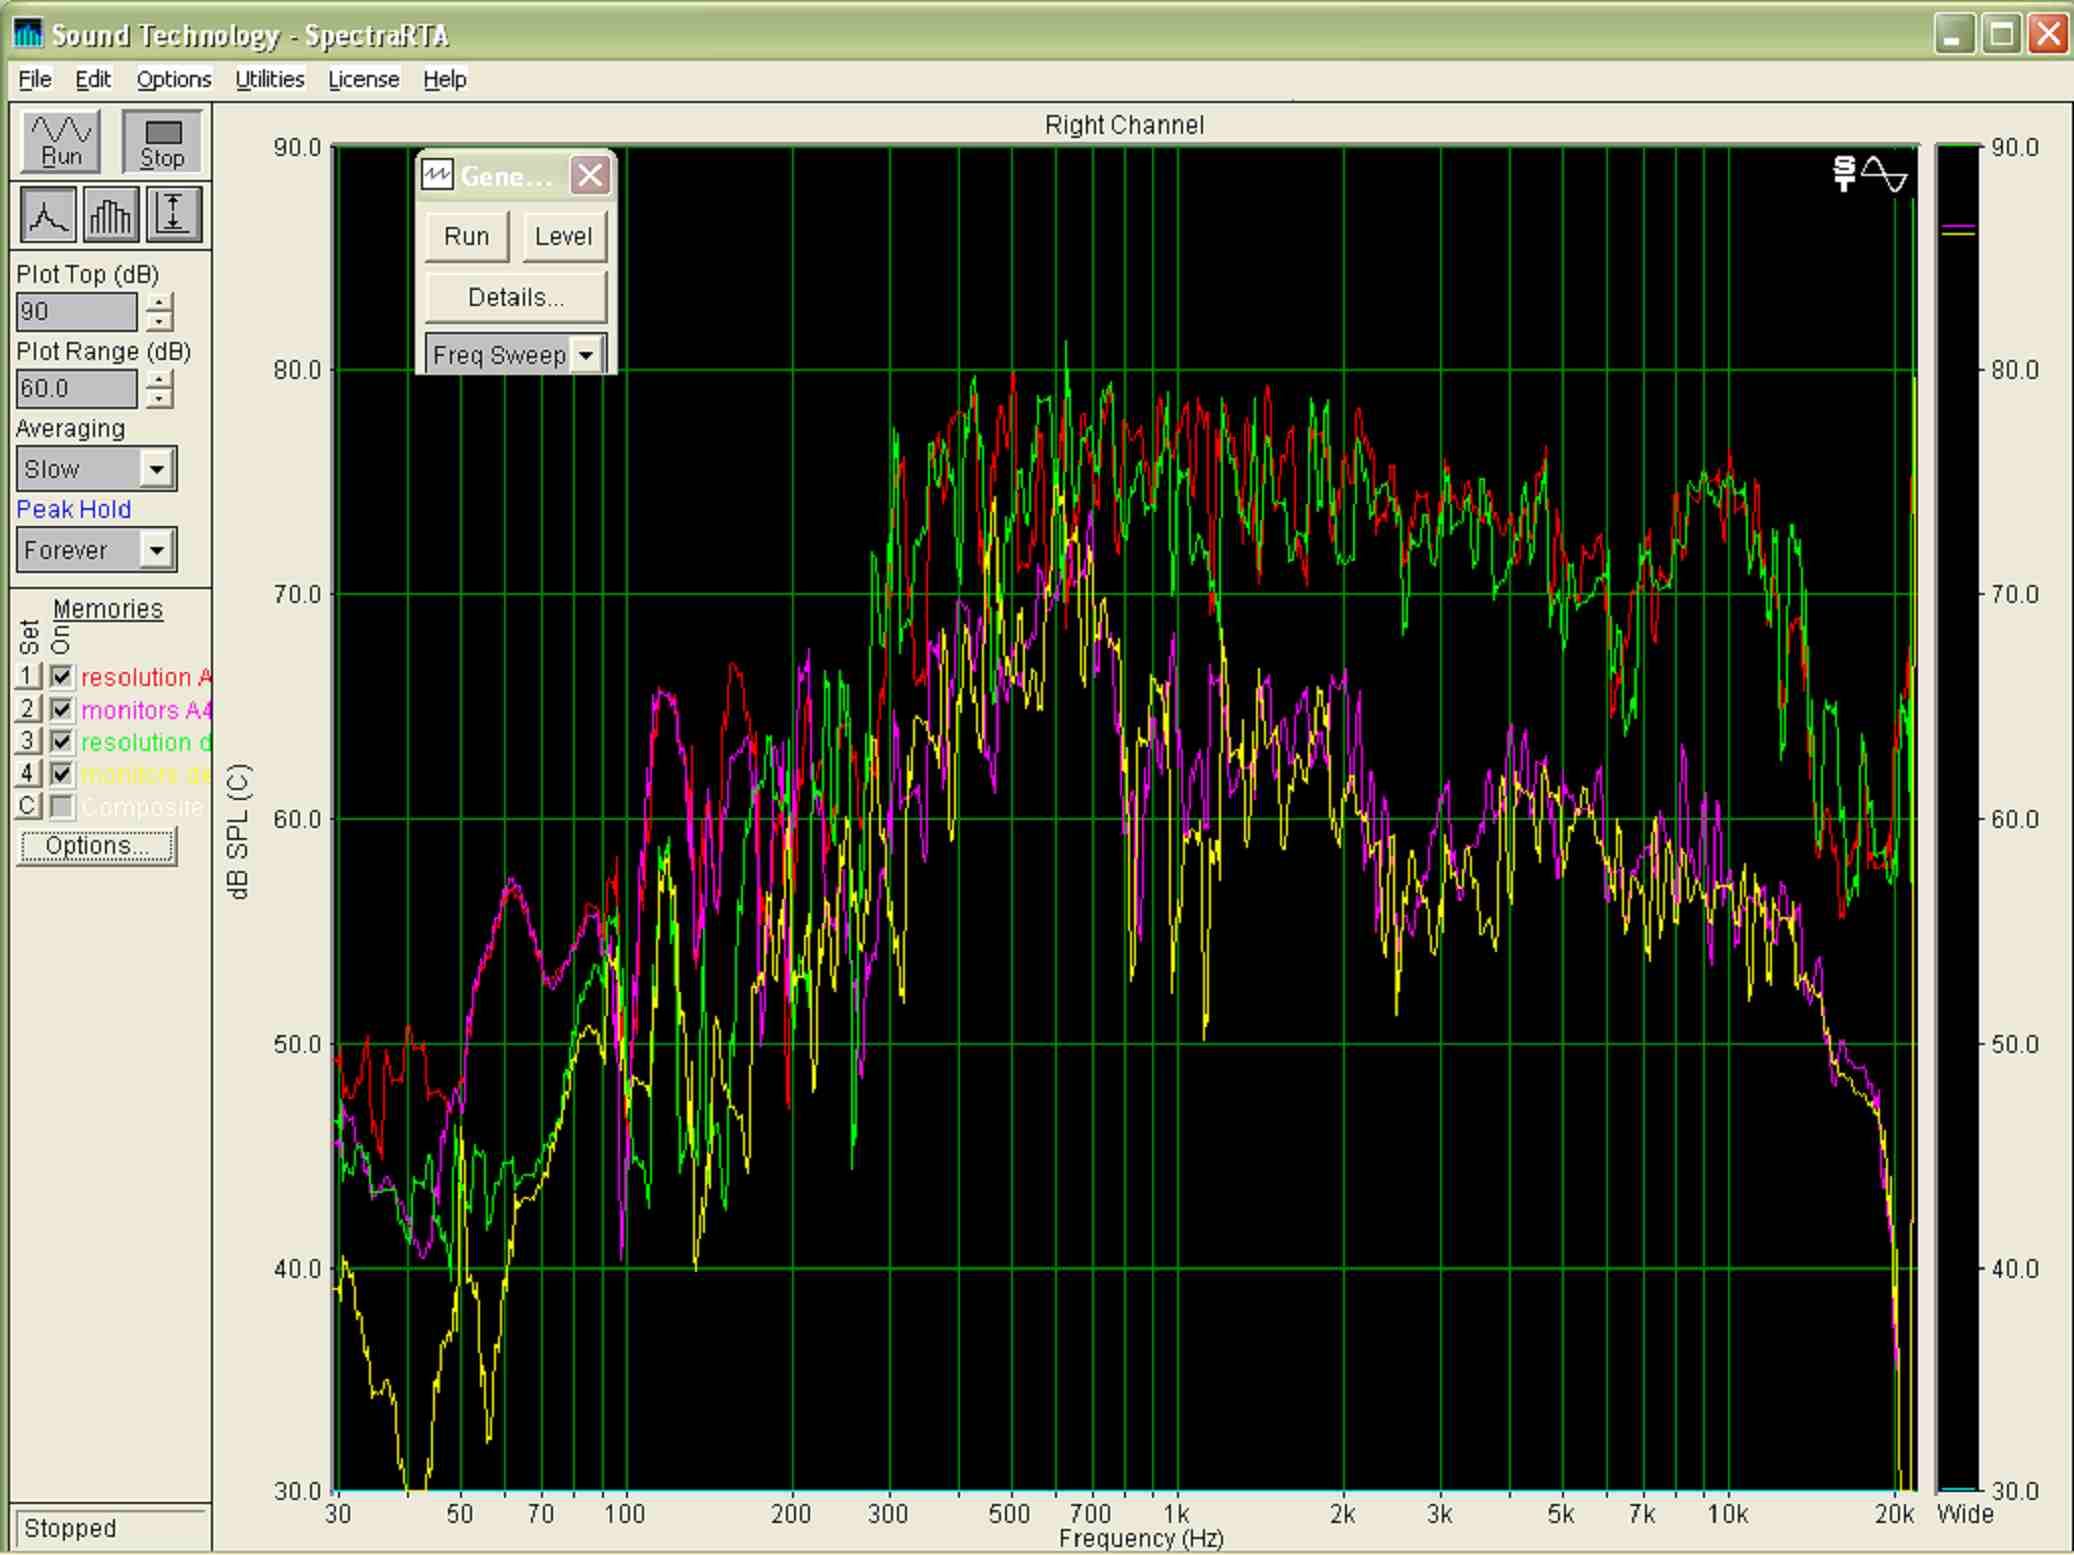
Above:

4 coloured curves measured Dec 17 2003(RTA), showing in lounge response measured @ 4m from 2 different loudspeakers and two different ampliers.

Key:

YELLOW- Studio monitors connected to Arcam Delta 60 amplifier

PINK - Studio monitors connected to Pioneer A400 amplifier

GREEN Resolution connected to Arcam Delta 60 amplifier

RED - Resolution connected to Pioneer A400 amplifier

the studio monitors were badged 'StudioCraft' by we believe BOSE/Marantz, and were two way fron ported reflex designed large bookshelf speaker. although not floorstanders - they are a high quality product and were better than several other floorstanders and bookshelfs we listened to.

Note please ignore the region below 45Hz as this was corrupted when the sweep went higher(max hold fn), but in fact continues down at the same slope as for 50-100hz.

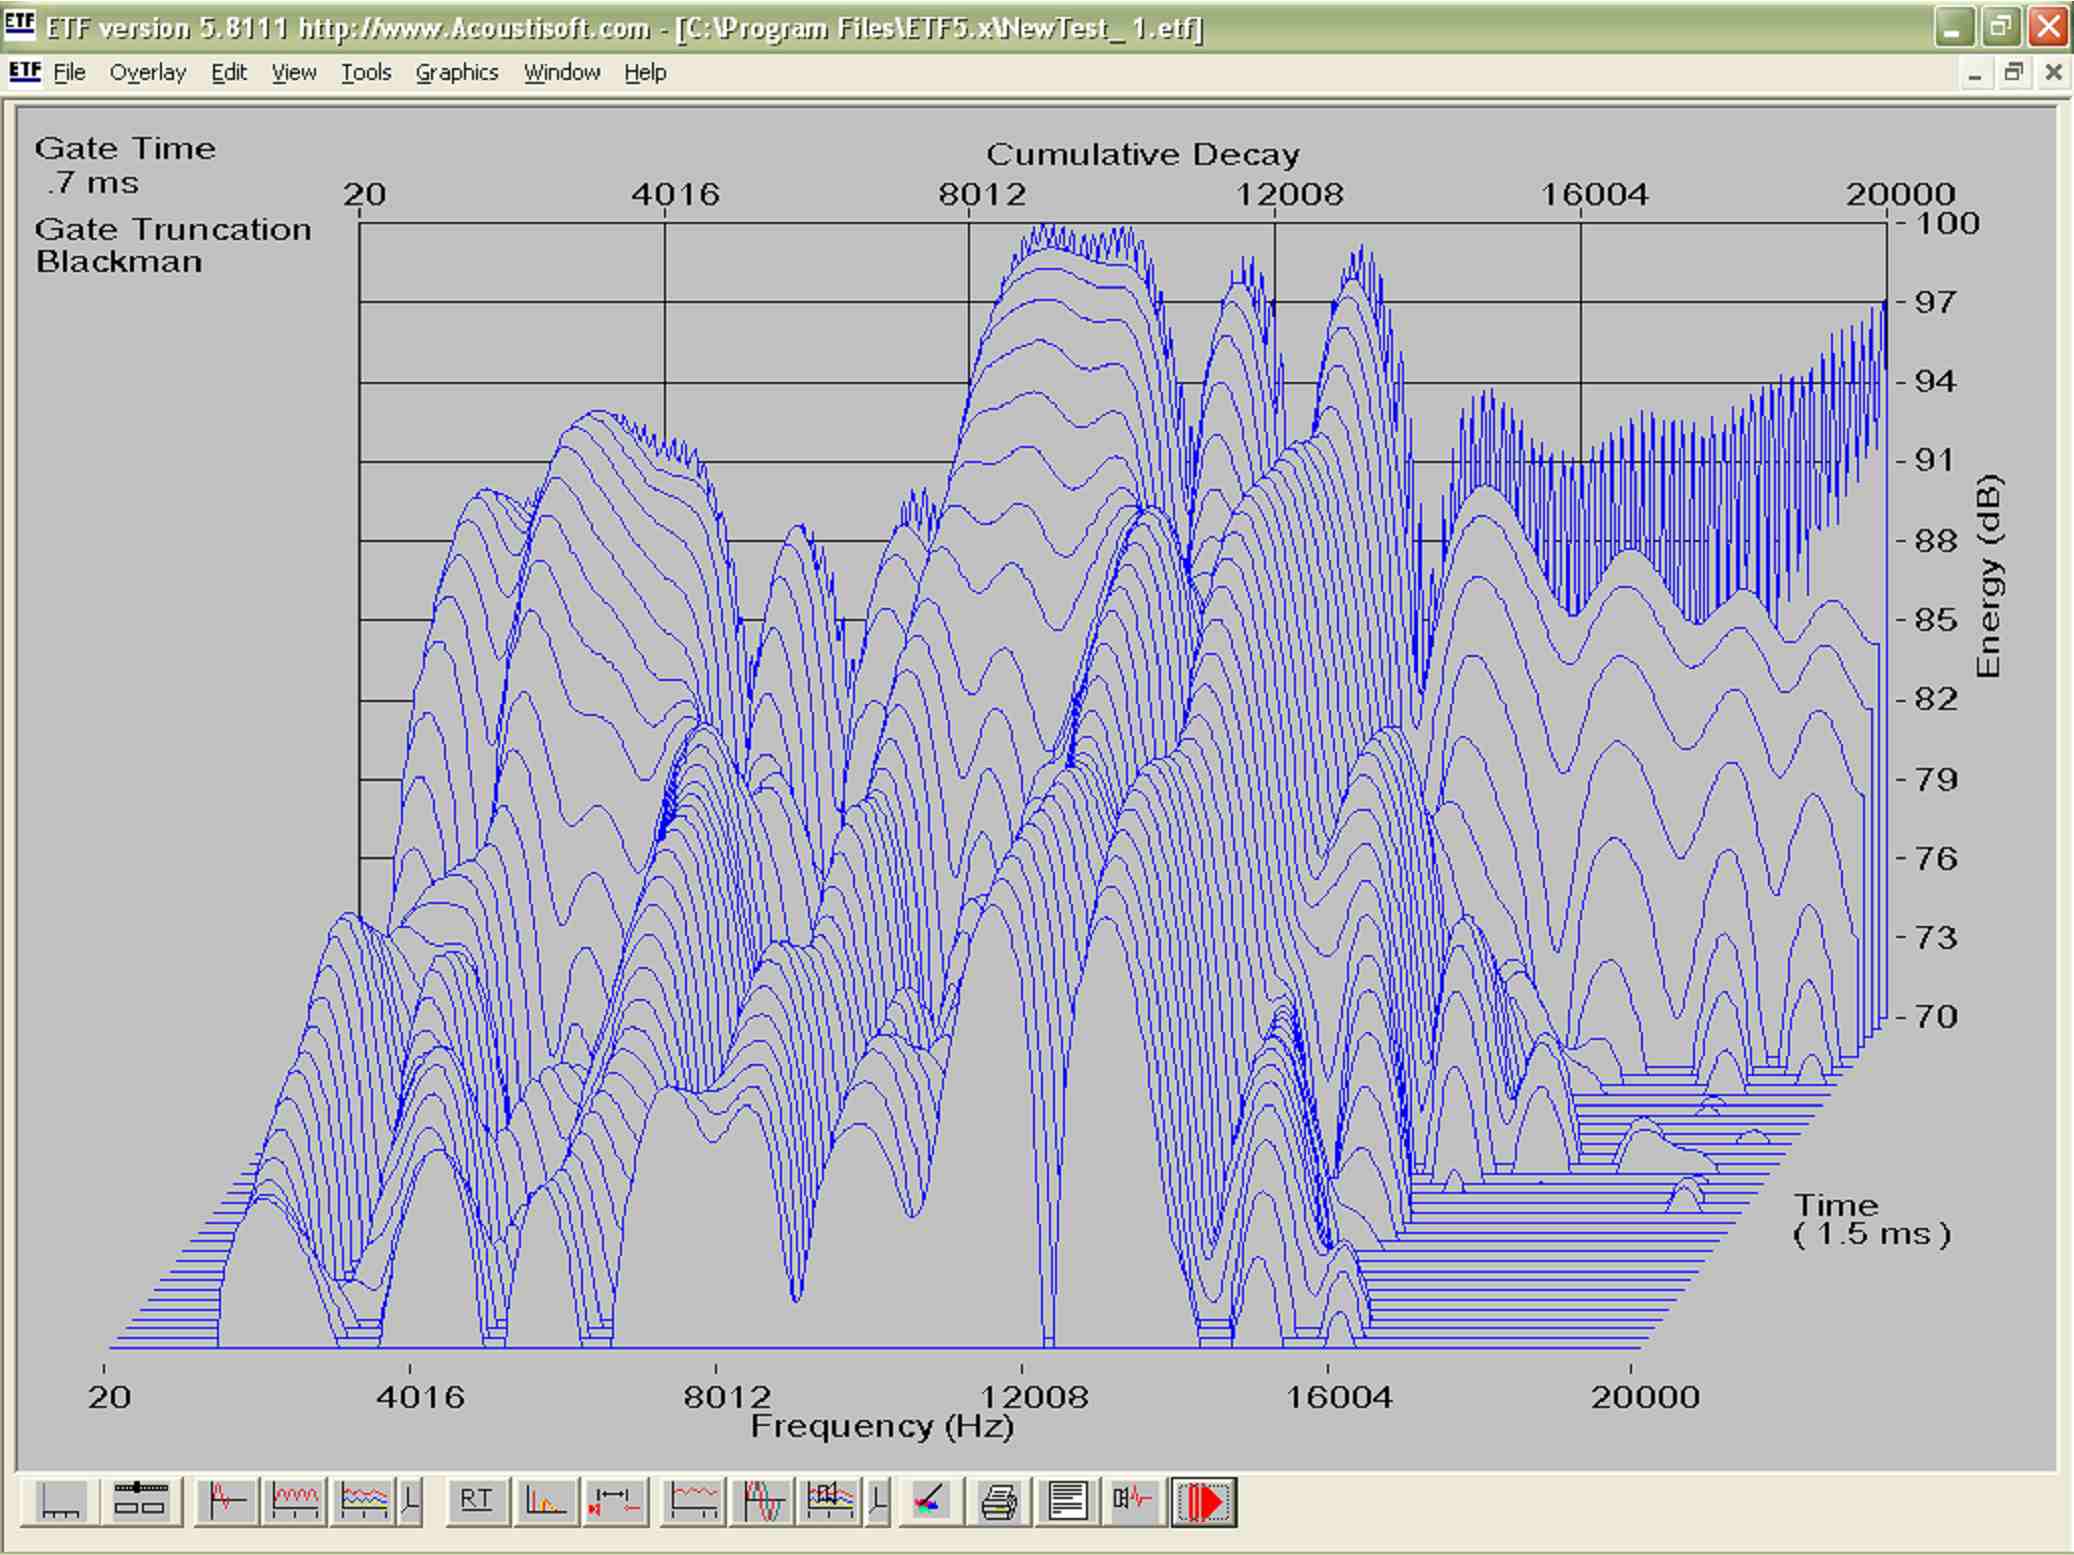
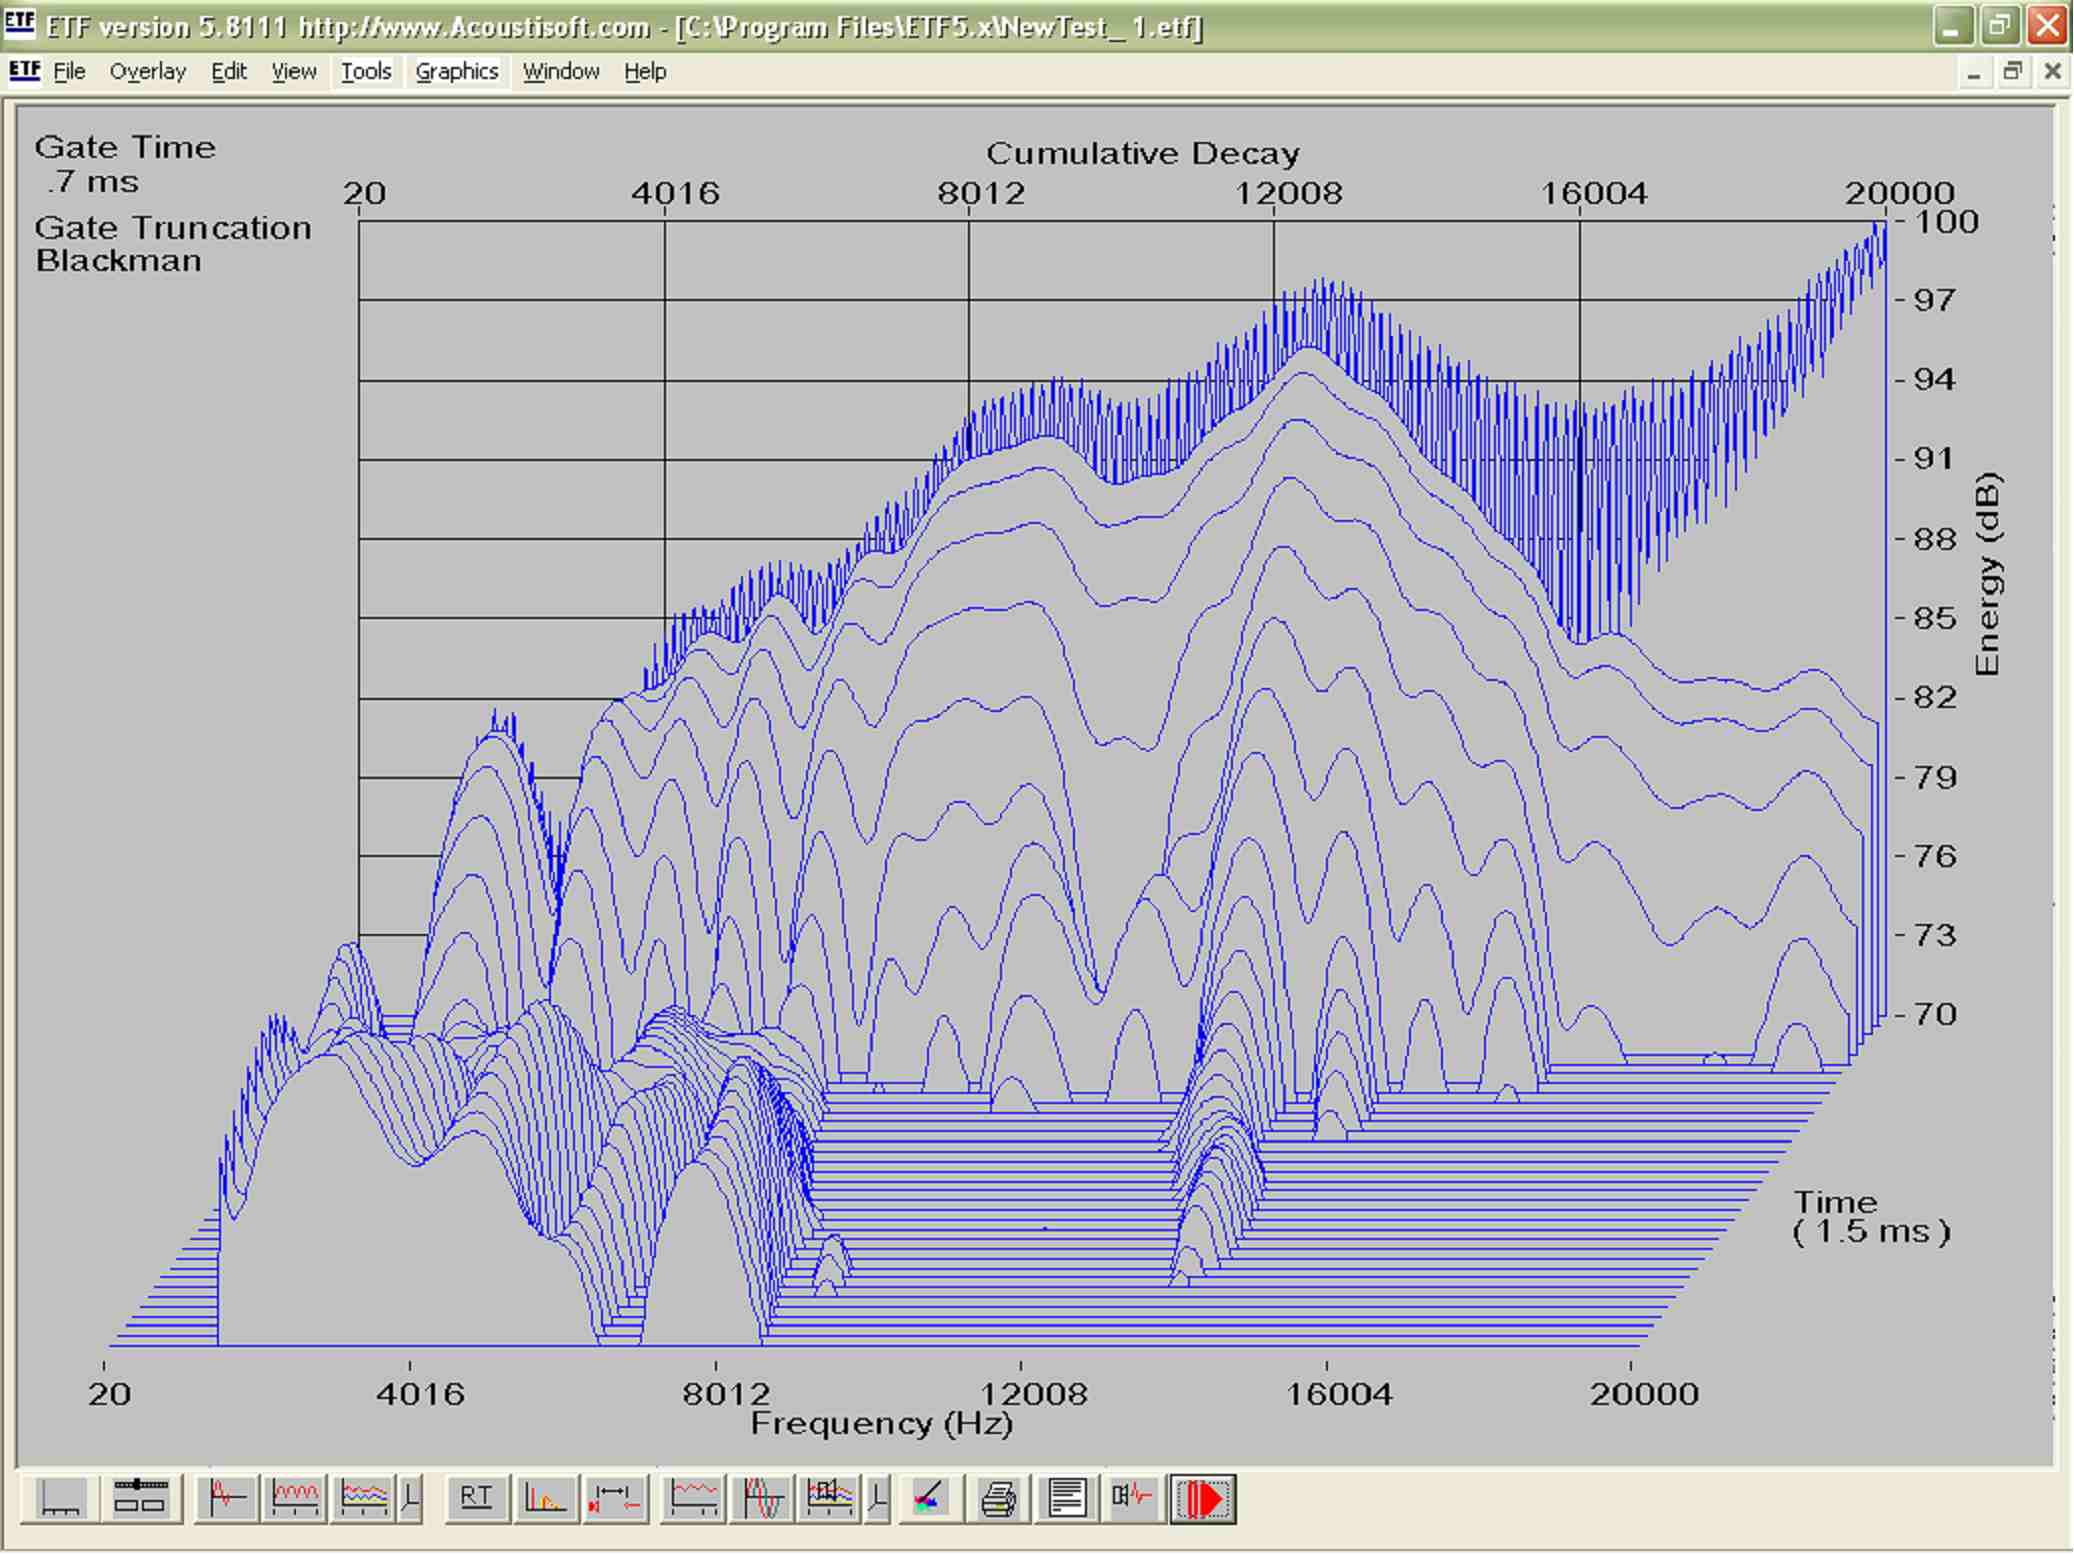
LF response

this is best plotted using ETF MLS software, which can gate out most 'room-boom' so you can measure the driver not the room as well. (please excuse mains hum@50hz spike as this is inherrent in PC measuring).

Above - Resolution LF response  

Notice the general level of the mid /bass is even, and roll-off is both gentle and undistorted

Above - Reflex Studio monitor LF response -

Note the hump at 400-700 Hz due to the port exaggerating, also note the trough 100-400Hz which has been sacrificed to do this. note the uneven bass curve generally, also uneven mid-band 800-1400hz has 20dB lower level than the reflex 'thud'.

Waterfall LF Plots:

Not a lot of use, but supposed to give reverberation/transient behaviour, as the third axis is time decay.

look fantastic though, as i'm sure you'll agree, not eveything in audio measurement is boring

Above: Resolution, then Reflex

appears all reflex can do is a bump with a delayed echo, and excessive damping. resonant behaviour evident in time seperation between peaks, trough above 14khZ evidence of sacrifice made to create bump.


29/1/4 update - this week I borrowed Andy's Quad ESL57s, and conducted my own tests on them -

ESL 57 results summary:

the electrostatics were excellent at snare drums and mid-range, but had no ability to produce bass below 100hz. the treble was a bit quiet though clear. the imaging was poor - due to the massive width and doubled bass plates in each. FR graphs matched manufacturers test data well which confirms the limited range, and the calibration of my own measurements. I built a special switch to conduct the listening test, so that the Rogers stereo valve amp could drive the ESLs, and an equalised Yamaha A-420 natural soun amp could power the resolutions - but the CD source was instantly switchable by remote button between the amps. this enabled me to adjust tone controls/levels to get the best/most similar sound from both systems, and then decide what the shortcomings/advantages of each were comparitively.

conclusion:

the resolutions were much better at treble, low bass, imaging, practicality, and detail. The ESLs mid-band between 1khz and 7khz was smoother, but vaguely positioned which was annoying. The ESL suffered from rattles if the bass was turned up louder than 70dB@3m, and a 80 hz resonance in the bass.

The ESLs perform best with classical music, as do the resolutions .

You are visitor number

[Resolution] [Product] [Sales] [About Us] [SiteMap]

Please contact our Webmaster with questions or comments.
© Copyright 2004.  All rights reserved.

UK Mainland Next day delivery only £37
International Delivery USA Europe Asia etc. in Resolution flight cases