Phase

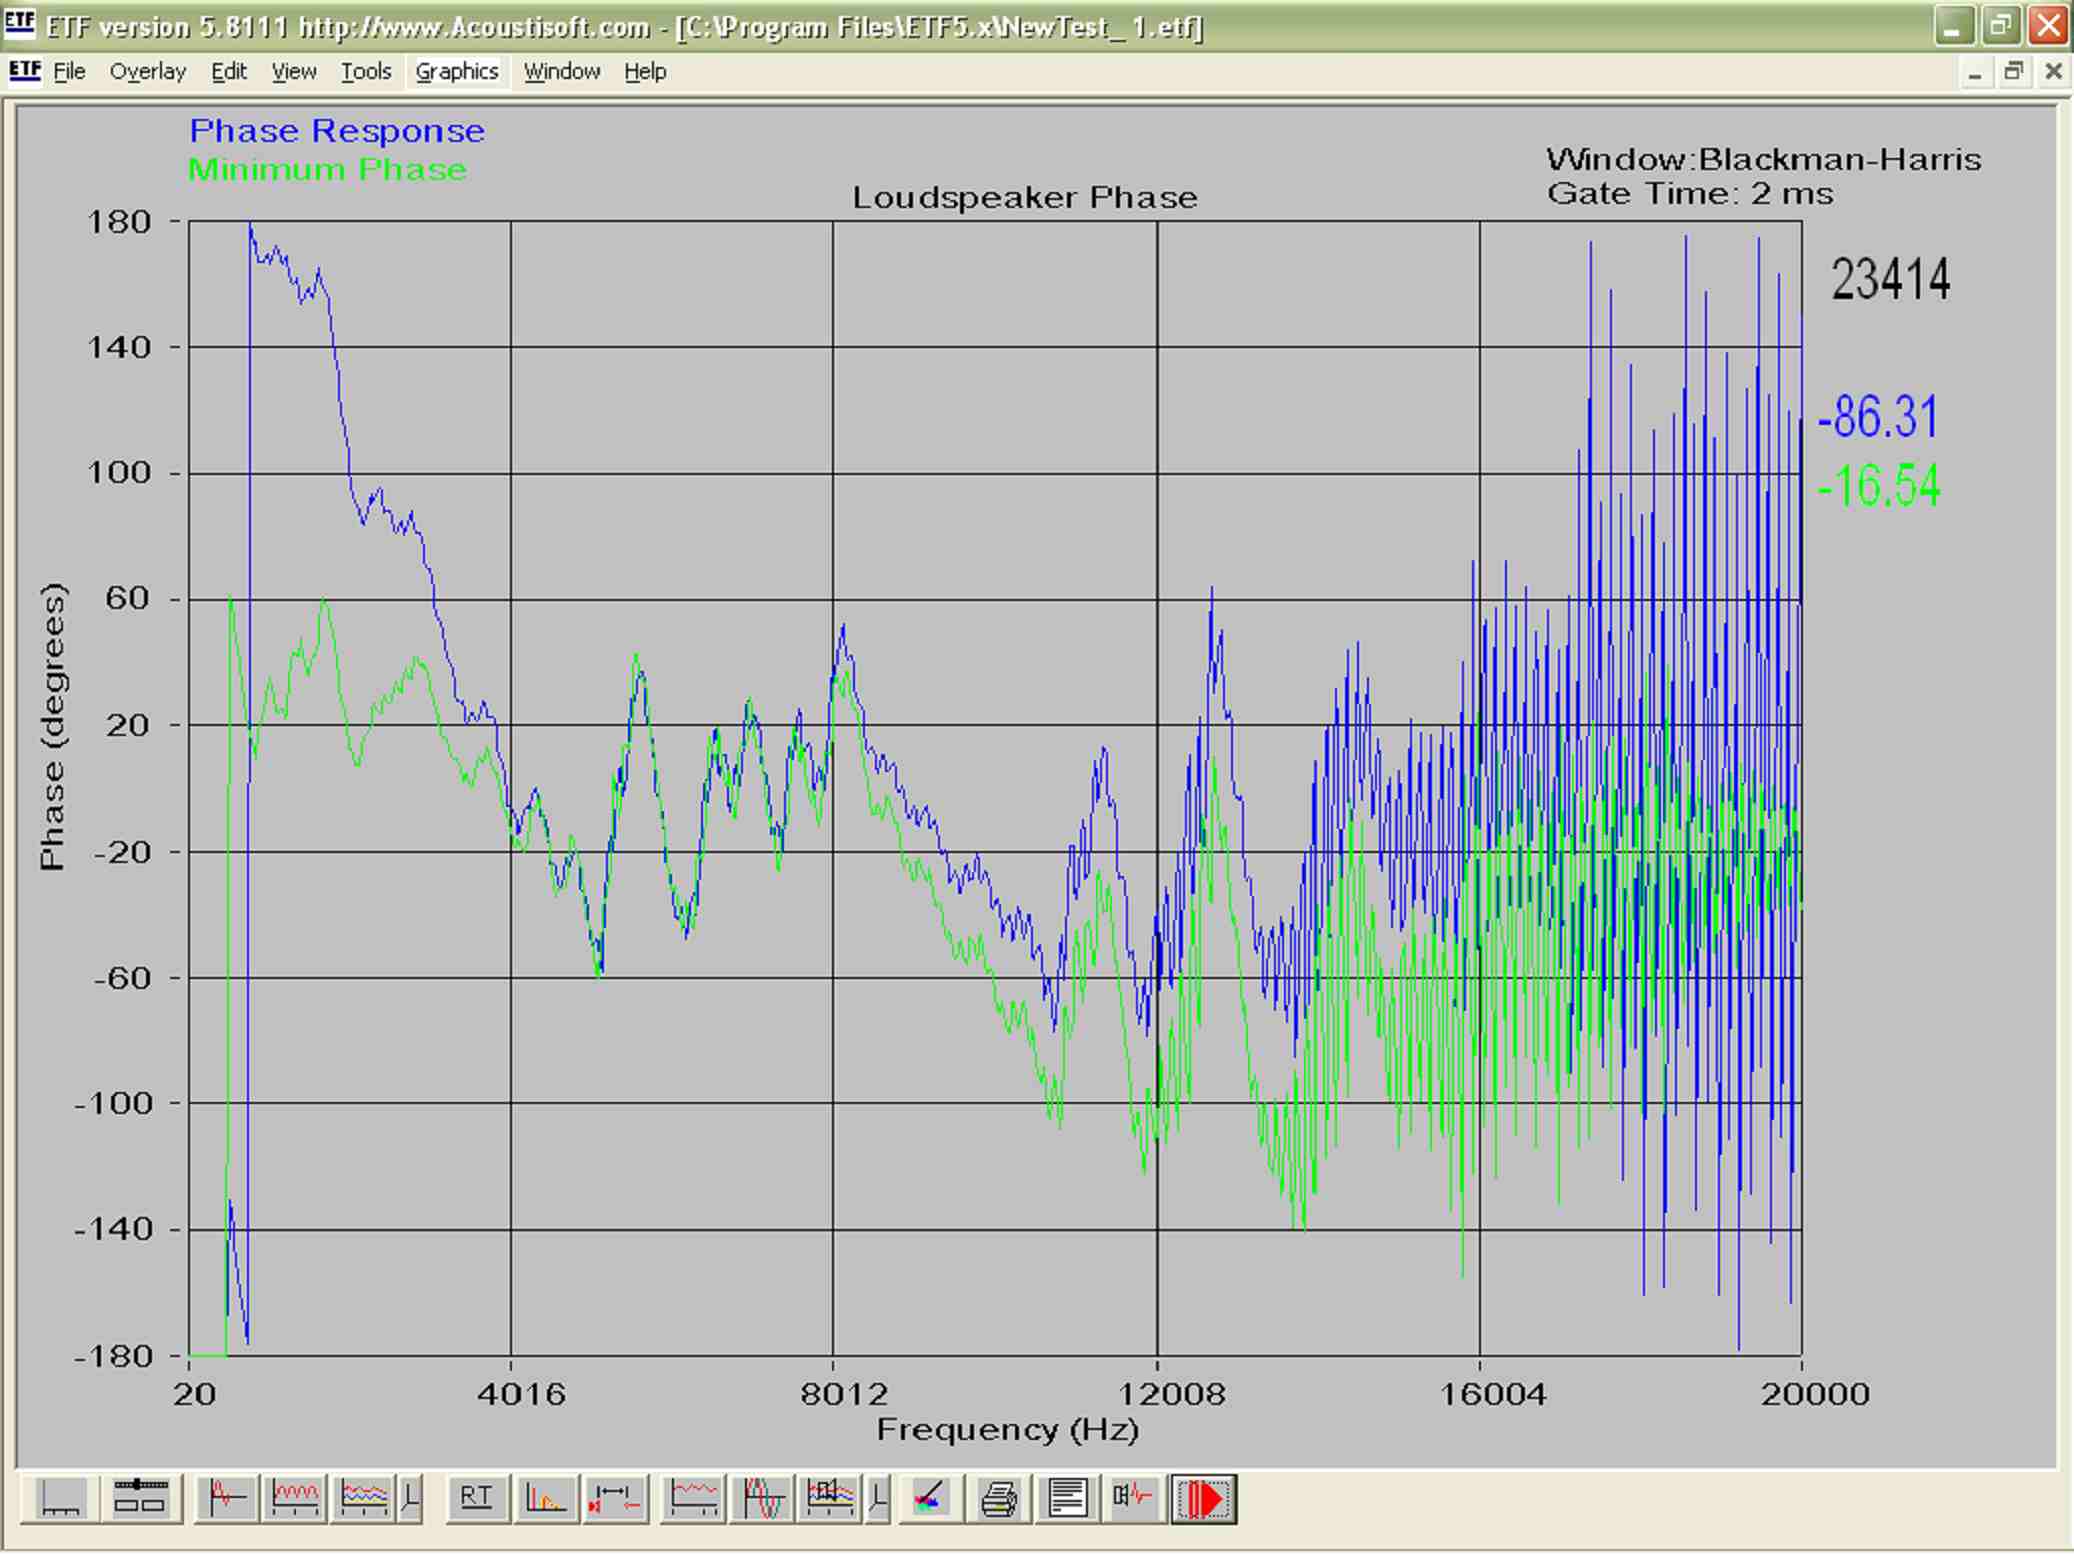
This graph shows Phase response of a resolution;

More difficult to interpret than FR means it is rarely seen, and is also beyond most labs ability to measure and present so clearly.

The green line is the soundcard datum, and the blue is the loudspeaker response - so the phase distortion due to the loudspeaker /amplifier(loudspeaker) is the difference.

Here you can interpret that the phase distortion is exceptionally well controlled accross the whole range.

see our advert in the buyers guide section
see our full page ad facing the buyers guide
see our full page

Above by contrast is a high quality Studio Monitor's result(mid-size 2-way reflex made by BOSE)

as you can see the pattern is different, and the difference between colours and the irregularity are much more concerning - it is obvious the reflex type of enclosure ruins phase in the bass region while to exaggerate the LF. also note the pronounced breakdown in the vocal frequencies and HF, probably due to poor tweeter performance, crossover distortions, and interactions between drivers.

Note: the tests were done repeatedly in controlled conditions during the same minute on the same rig, to ensure the only variable was the loudspeaker connected.

You are visitor number

[Resolution] [Product] [Sales] [About Us] [SiteMap]

Please contact our Webmaster with questions or comments.
© Copyright 2004.  All rights reserved.

UK Mainland Next day delivery only £37
International Delivery USA Europe Asia etc. in Resolution flight cases